


CMG has a rich history of bringing industry-first solutions to the market. Our expertise encompasses a broad spectrum of energy workflows and our technology can help energy companies navigate this complex landscape.
We partner with industry-leading organizations to ensure our customers have the end-to-end support they need. Whatever your challenge is, one of our preferred partners would be happy to work with you.


Our CMG 4.0 Strategy, announced in 2022, is a multi-faceted transformation strategy focused on growth, profitability, and acquisitions.
Stock quotes are 15-minute delayed
We are a global software and consulting company that combines science and technology with deep industry expertise to solve complex subsurface and surface challenges for the new energy industry around the world.
We’ve created a wealth of educational assets to advance your industry and technical capabilities.

View Available Training Courses
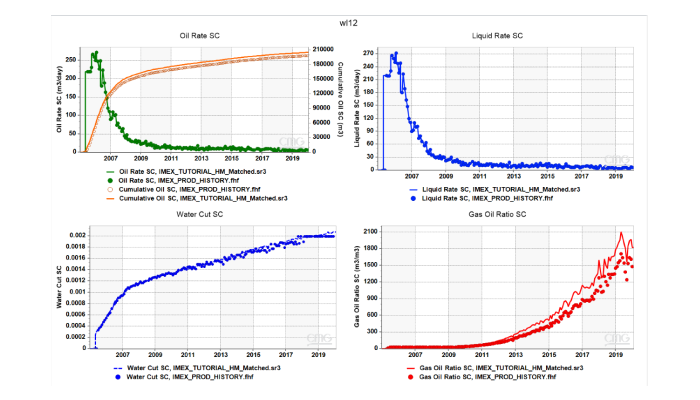
Results™ delivers state-of-the-art visualization and analysis capabilities to provide insight into reservoir characteristics, recovery processes, and reservoir performance.
Quickly compare simulation outputs with field history data, analyze multiple views in the same window, and personalize the interface to show plots of interest.
Reservoir simulation output files can grow larger due to model size and complexity of the recovery process which may increase loading time and memory requirements. To improve simulation post-processing activities, Results uses the “SR3” output format which is a compressed and smaller file size, from all simulators – IMEX™, GEM™ and STARS™.
Easily access multiple features for increased flexibility when creating plots, grouping data, and analyzing results.
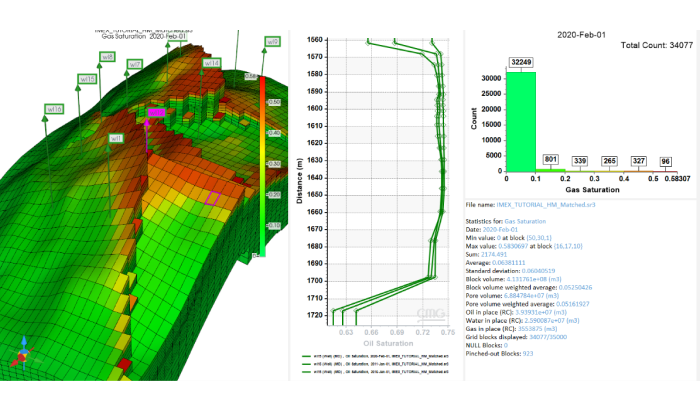
Combining the power of 2D and 3D visualization into one tool allows for faster and more efficient results analysis. The enhanced visualization capabilities increase the depth of analysis, allowing users to compare plots and discern subtle differences that may not be detected when switching between multiple post-processing applications.
Estimate performance, recovery factor, and Net Present Value (NPV) effectively during field development planning. The enhanced reporting functionality enables users to easily communicate simulation results in both 2D and 3D formats for increased understanding.
Results™ delivers state-of-the-art visualization and analysis capabilities to provide insight into reservoir characteristics, recovery processes, and reservoir performance.
Legal Notice | © Copyright 2024 Computer Modelling Group Ltd.