
Post-Processor:
Visualization & Analysis
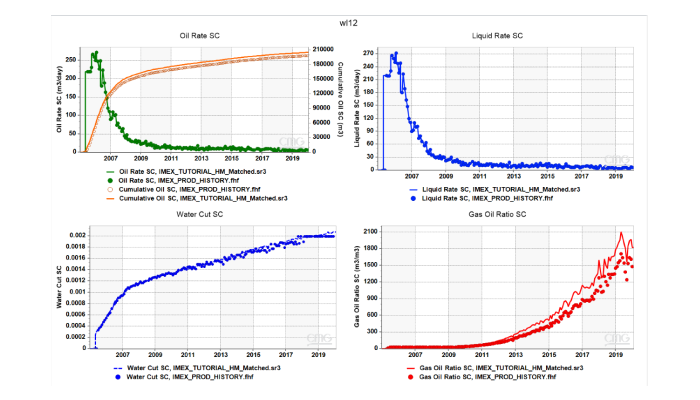
Results™ delivers state-of-the-art visualization and analysis capabilities to provide insight into reservoir characteristics, recovery processes, and reservoir performance.
Quickly compare simulation outputs with field history data, analyze multiple views in the same window, and personalize the interface to show plots of interest.
Optimized Output Format for Simulations
Reservoir simulation output files can grow larger due to model size and complexity of the recovery process which may increase loading time and memory requirements. To improve simulation post-processing activities, Results uses the “SR3” output format which is a compressed and smaller file size, from all simulators – IMEX™, GEM™ and STARS™.
Flexible Plotting and Data Analysis
Easily access multiple features for increased flexibility when creating plots, grouping data, and analyzing results.


Enhanced Visualization for Efficient Analysis
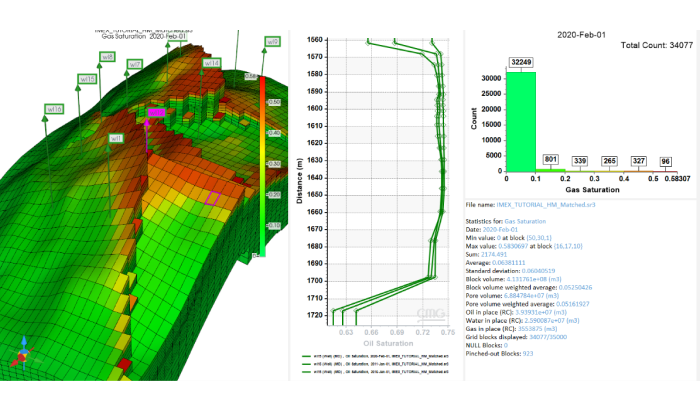
Combining the power of 2D and 3D visualization into one tool allows for faster and more efficient results analysis. The enhanced visualization capabilities increase the depth of analysis, allowing users to compare plots and discern subtle differences that may not be detected when switching between multiple post-processing applications.
Effective Field Planning and Reporting
Estimate performance, recovery factor, and Net Present Value (NPV) effectively during field development planning. The enhanced reporting functionality enables users to easily communicate simulation results in both 2D and 3D formats for increased understanding.
Benefits
- Make fast and informed decisions about improving recovery and performance for a well or a field.
- Real-time updating of results as simulation progresses.
- Complete integration of production and property profile plotting within one tool.
- Output to 3D geological software to complete the workflow from seismic to simulation and back.
Key Features
- With the new flow allocation dashboard, interactively explore allocation factors and produced/injected volumes.
- Export to RESQML with improvements to property/time step specifications.
- Export grid properties to a text file in a node based format and reservoir properties via .SIF or GSLIB formats.
- Verify inputs using the cross-plot display tool which allows property versus property comparisons.
- Use the curve override interface to make property modifications on a project-wide basis.
- Analyze fluid flow with tracer visualization.
Take your technical skills from the classroom to your workplace
Results™ delivers state-of-the-art visualization and analysis capabilities to provide insight into reservoir characteristics, recovery processes, and reservoir performance.