Accurately predicting CO₂ plume migration is critical for the success of carbon capture, utilization, and storage (CCUS) projects. However, there is an opportunity to further enhance existing workflows by incorporating time-lapse monitoring data alongside modelling assumptions.
In this study, a novel workflow was developed to integrate 4D seismic imaging with dynamic reservoir simulation, enabling spatial history matching and improved plume prediction using CMG GEM, Sharp Reflection, and Bluware AI tools.
Applied to the Sleipner CO₂ storage project, the approach demonstrated efficient plume identification using AI-driven seismic interpretation, direct integration of seismic plume geometry into simulation models, improved history matching using spatial comparison metrics, and quantification of plume growth for Area of Review (AoR) assessment.
Outcome: Matching plume geometry, and not just production data, fundamentally improves confidence in CO₂ storage predictions.
The Challenge: How can operators ensure that simulated plume behavior matches reality?
Reservoir simulation workflows are inherently forecast-driven, relying on assumed reservoir properties. However, CO₂ storage introduces additional challenges:
- need for regulatory compliance, including Area of Review (AoR)
- need for forward seismic to determine the next time seismic imaging is needed
- need for plume monitoring
What made this workflow unique?
This study introduces a workflow that connects what is observed through seismic data with what is simulated in the reservoir model.
In simple terms, the workflow links:
What is observed (seismic) ↔ What is simulated (reservoir model)
Step 1: AI-Driven Seismic Interpretation
4D seismic data from Sleipner from 1994 to 2010 was processed using:
- Bayesian inversion to generate CO₂ probability volumes
- deep-learning interpretation to identify plume geobodies
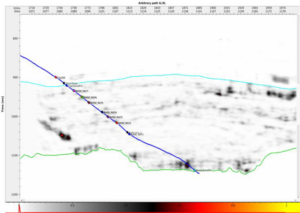
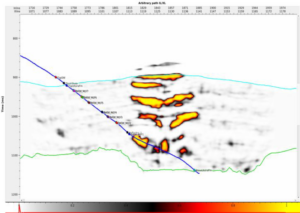
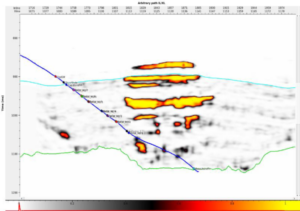
Figure 1. Seismic Inversion and CO₂ Plume Identification Over Time
Time-lapse seismic inversion results show plume evolution from pre-injection in 1994 to later years. Inverted vintages for porosity, probability volumes, and temperature-dependent CO₂ density were used to estimate the total mass of injected CO₂, which had strong agreement with actual injected CO₂ mass.
Insight
CO₂ plumes were identified using only 0.33% of the seismic data, demonstrating the efficiency of AI-assisted interpretation.
Step 2: Converting Seismic Data into Simulation Inputs
Seismic plume geometry was:
- converted from time to depth
- mapped into grid cells
- represented as binary plume properties
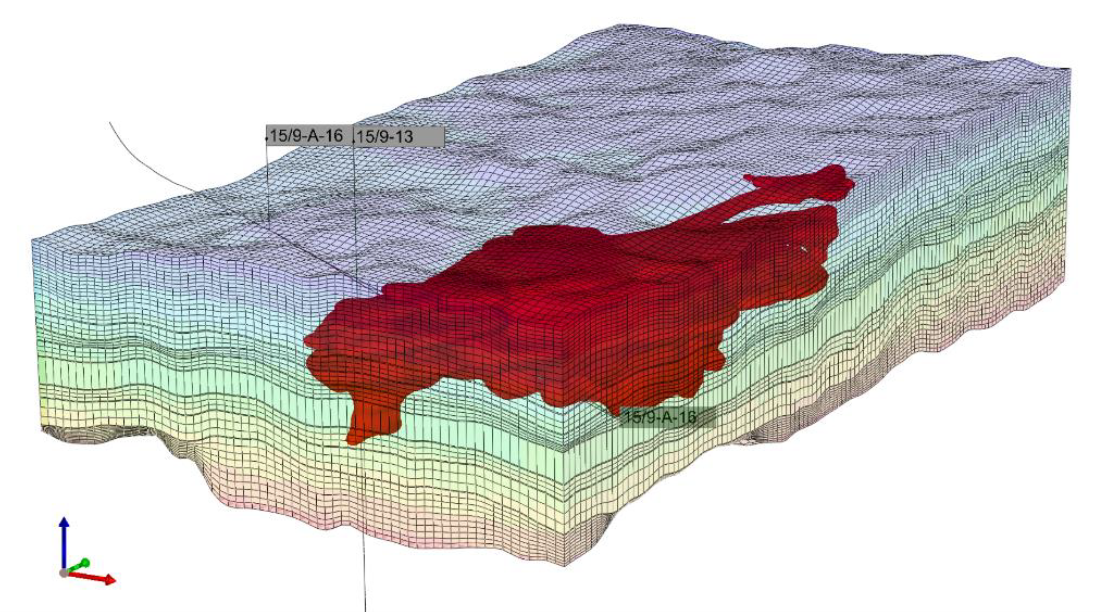
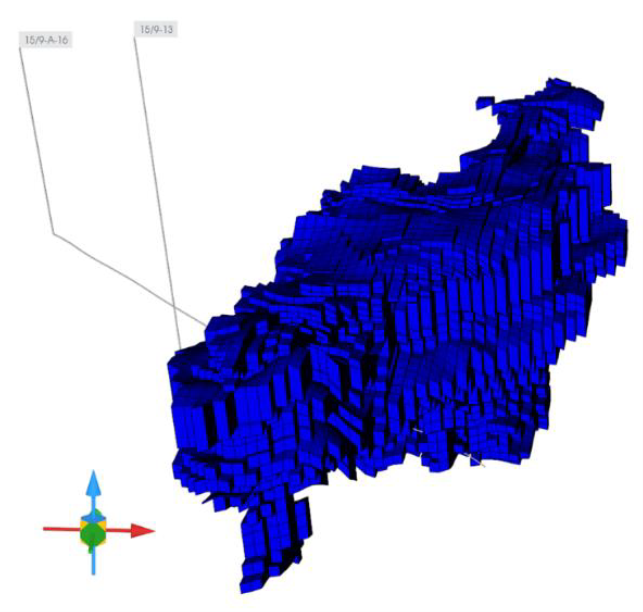
Figure 2. Integration of Seismic-Derived Plume into Simulation Grid
The 3D visualization shows how seismic plume geometry is mapped onto simulation grids, enabling direct comparison with dynamic model outputs.
Insight
This enables direct comparison between observed plume geometry and simulated gas saturation.
Step 3: Spatial History Matching
Instead of matching only production data, the workflow matches plume geometry in space.
This is done using:
- gas saturation from simulation
- seismic-derived plume boundaries
Insight
This transforms history matching from a curve-fitting problem into a spatial validation problem.
Step 4: Identifying Key Controlling Parameters
Sensitivity analysis revealed that vertical permeability of shale layers is the dominant control on plume behavior.
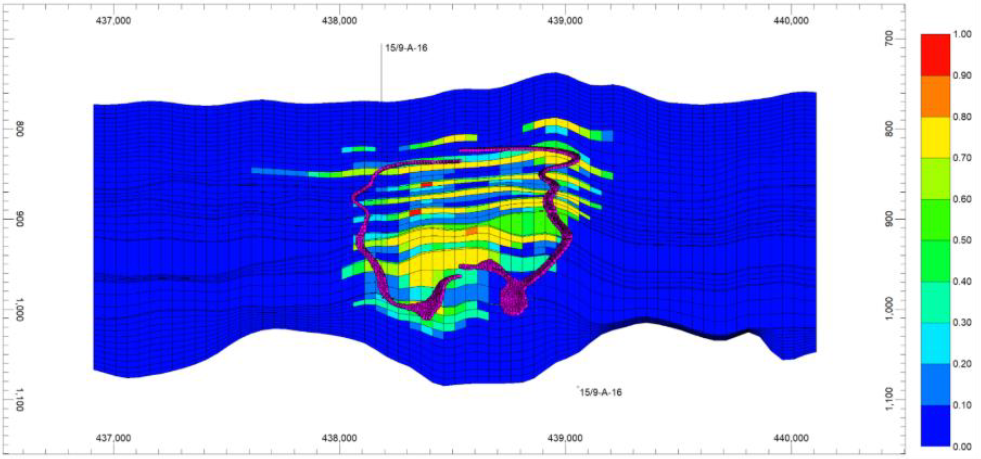
Figure 3. Comparison of Simulated and Seismic-Derived Plume Geometry (1999)
Alignment between simulated gas saturation and seismic plume boundaries is improved by automated history matching after parameter calibration.
Insight
Thin shale layers significantly restrict vertical migration, controlling plume height. Their topography also controls lateral spread.
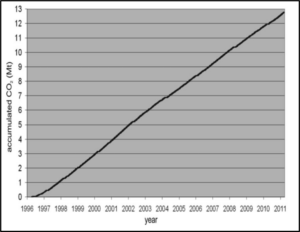
Step 5: Quantifying Plume Growth and Area of Review
The plume was tracked over time:
- 2001: ~1 km²
- 2010: ~3.3 km²
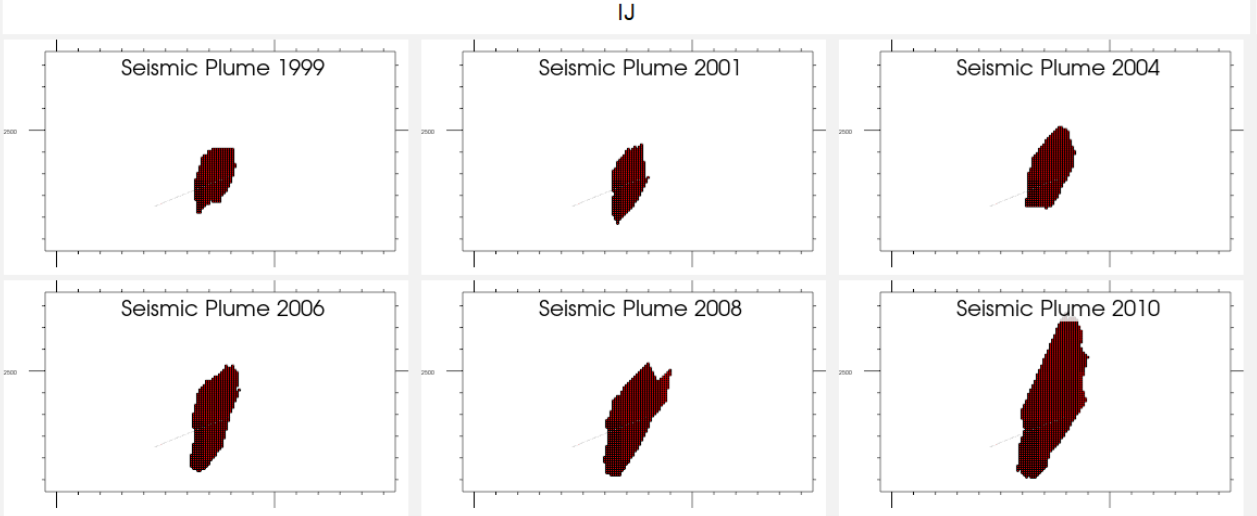
Figure 4. CO₂ Plume Area Growth Over Time
The plume expands laterally after reaching the top of the formation, increasing the Area of Review (AoR) over time.
Insight
Plume evolution transitions from vertical growth to lateral spreading once structural limits are reached.
Why This Matters
This workflow enables:
- continuous validation of simulation models
- improved confidence in CO₂ containment
- better regulatory compliance through AoR tracking
- reduced uncertainty in long-term storage predictions
Key Takeaways
- Spatial history matching improves model reliability
- Vertical permeability is a critical control on plume behavior
- AI significantly accelerates seismic interpretation
- Coupled workflows between CMG GEM, CMOST, Bluware AI, and Sharp Reflection tools enable more accurate CCUS decision-making
Conclusion
This study demonstrates that integrating 4D seismic data with dynamic simulation fundamentally improves the reliability of CO₂ plume prediction.
By combining AI-driven seismic interpretation, spatial history matching, and sensitivity analysis, engineers can enhance forecasting workflows with data-driven, observation-constrained modelling.
Ultimately, this workflow provides a more robust foundation for ensuring long-term CO₂ containment, regulatory compliance, and project success in CCUS operations.